Control Tower
Monitor the vital signs of your logistics operations with a single control tower

Control Tower
Monitor the vital signs of your logistics operations with a single control tower


Increase visibility and take control of your operations
Control Tower uses a methodology that allows you to identify and prioritize key performance indicators (KPIs), in addition to enabling a continuous improvement process that synchronizes your supply chain. With this control tower, gain visibility of your operations to make the best decisions at the right time.

Have you noticed these problems in your operation?
Experience the power of Control Tower in your supply chain
Your supply chain in one place
Integrate
Control Tower integrates data from different sources and centralizes the information of your operation in one place.
Implement
This logistics control tower generates useful information for your business through the use of Artificial Intelligence, Machine Learning, and Business Intelligence models and tools.
Analyze
This technology analyzes data and trends to turn them into knowledge and prescriptive actions.
Visualize
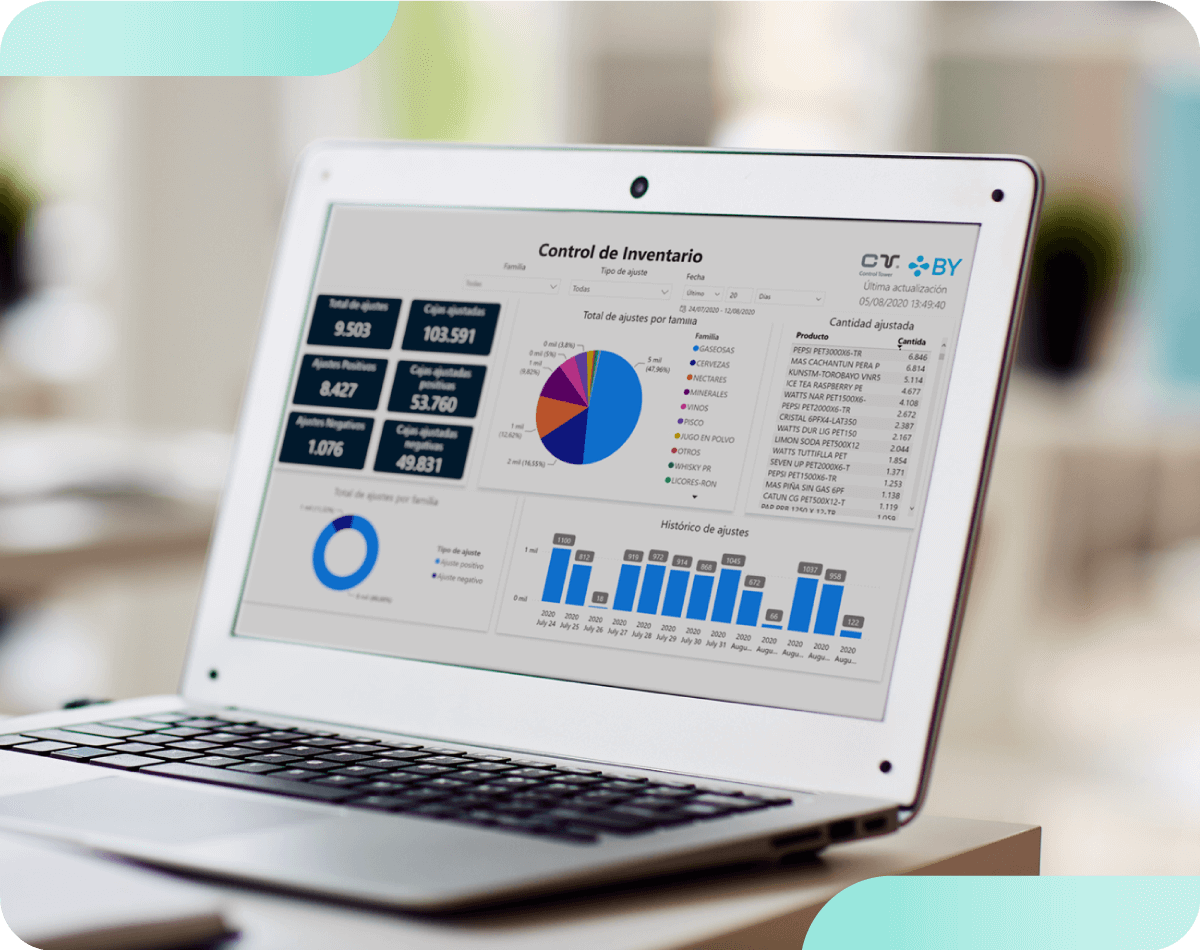
Control Tower brings together the information produced by the entire supply chain to view it in one place with Microsoft Power BI.
Some of our global clients
Control Tower is the perfect tool for our logistics operation because it gives us real-time visibility. Thanks to the flexibility, scalability and easy use of this logistics control tower, we can know the origin of our information, create key performance indicators and enhance strategic decision-making.

Gustavo Domínguez
Director of Operations
jjjj
Control Tower is the perfect tool for our logistics operation because it gives us real-time visibility. Thanks to the flexibility, scalability and easy use of this logistics control tower, we can know the origin of our information, create key performance indicators and enhance strategic decision-making.

Gustavo Domínguez
Director of Operations
Frequently asked questions
Do I have to manually update the information?
No, ETL processes (extract, transform, load) are created to automate information download as often as necessary.
Can Control Tower get information from other systems, such as my ERP?
Yes, it is possible to create data extraction procedures from different sources to map the origin of each piece of information.
How can I identify which indicators I need to measure?
Netlogistik's Control Tower methodology allows you to identify the key business processes and factors to prioritize, design, and implement the KPIs that require attention.
What tool is used by Control Tower to visualize KPIs?
Control Tower operates with Microsoft's Power BI.
Discover more solutions to transform your operation
-
-
-


